Q2 2026 Android User Preference Report -- Global Markets
Following the Q1 2026 report, the Q2 edition continues to track the configuration preferences of AnTuTu users in the global market (excluding mainland China), based on valid device data collected through the AnTuTu Benchmark app between April and June.
This report covers eight key dimensions: screen size, screen resolution, screen refresh rate, processor brand, CPU core count, RAM, storage, and Android version. The figures reflect AnTuTu users only and should not be read as overall Android market data.
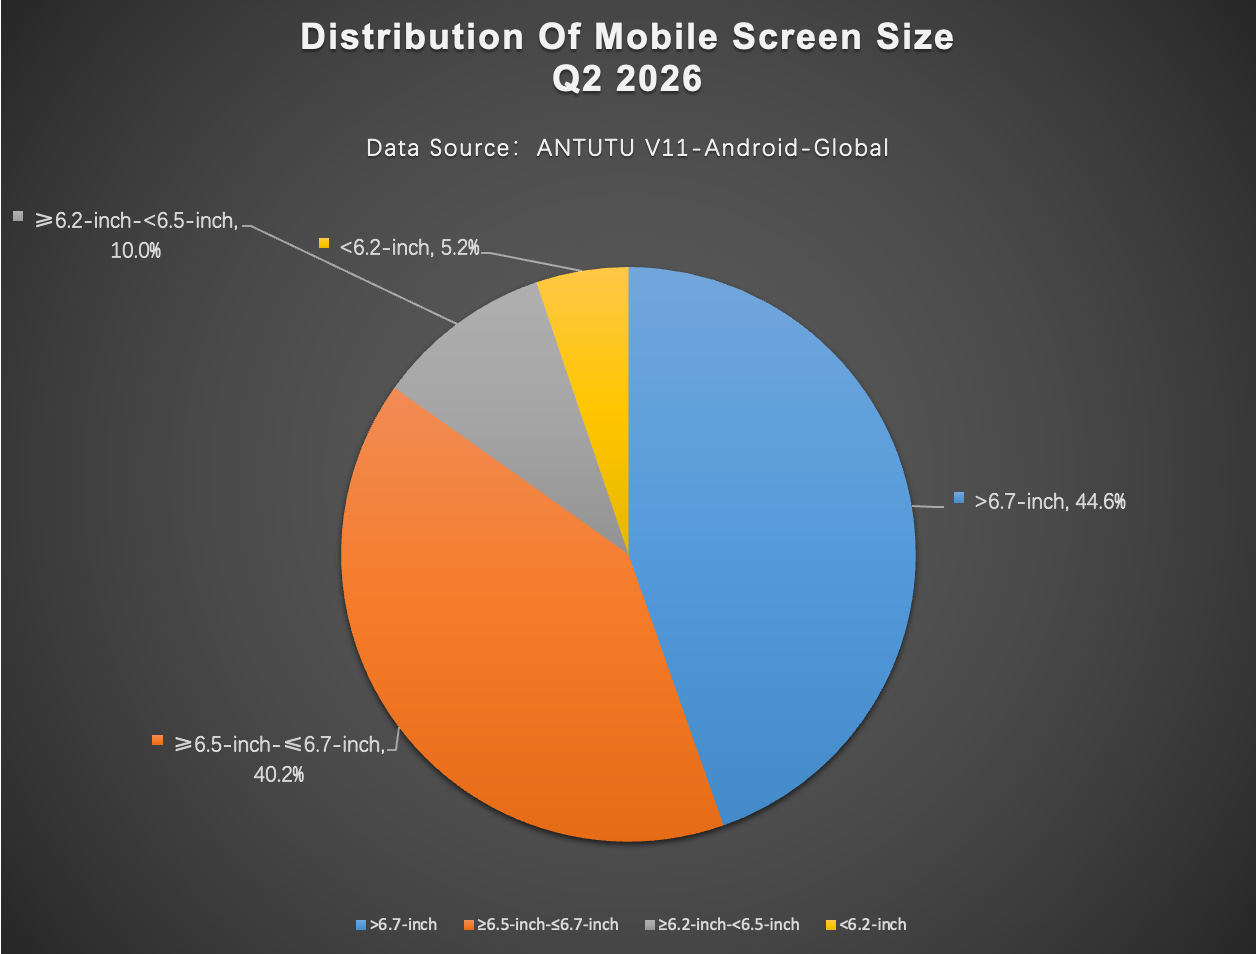
SCREEN SIZE
Over 6.7 inches: Q1 48.4% -> Q2 44.6%, a decline of 3.8 percentage points
6.5-6.7 inches: Q1 36.5% -> Q2 40.2%, a gain of 3.7 percentage points
6.2-6.5 inches: Q1 9.8% -> Q2 10.0%, a gain of 0.2 percentage point
Under 6.2 inches: Q1 5.3% -> Q2 5.2%, a decline of 0.1 percentage point
Large-screen devices remained dominant in Q2, but the lead of the over-6.7-inch category narrowed. Its share fell to 44.6%, while the adjacent 6.5-6.7-inch tier climbed to 40.2%.
Together, these two largest screen-size groups still account for 84.8% of the sample. The under-6.2-inch category changed little, staying at 5.2%.
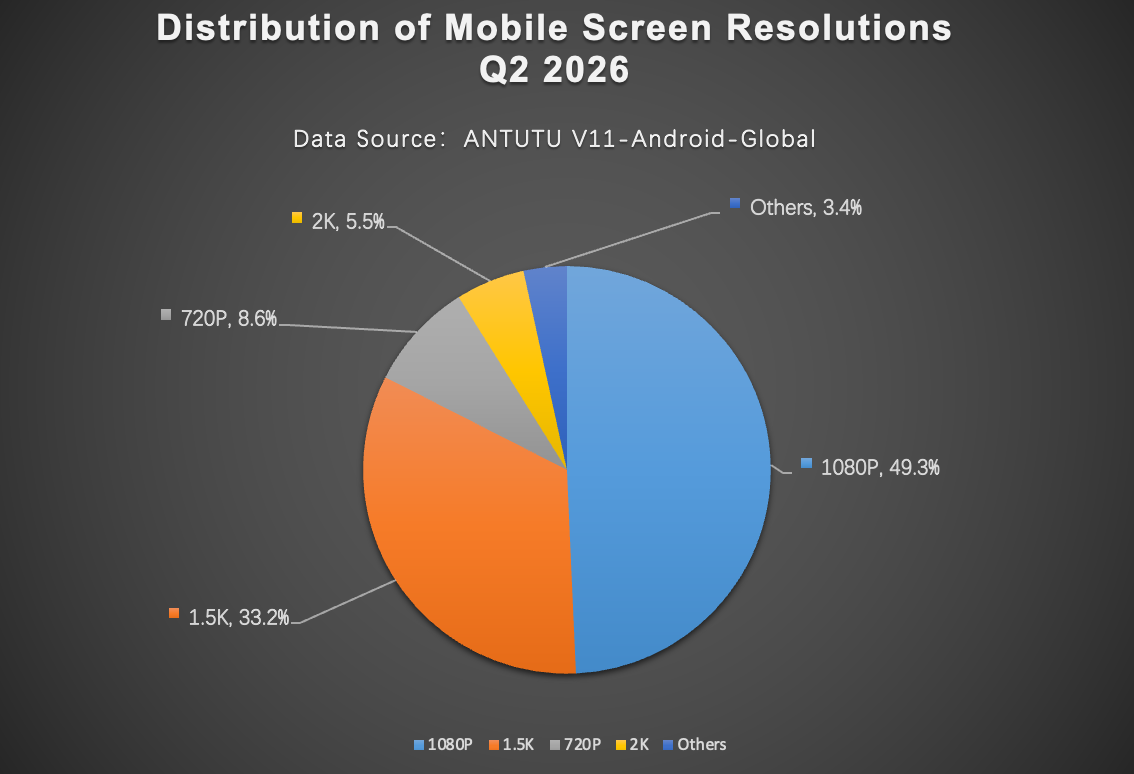
SCREEN RESOLUTION
1080P: Q1 51.9% -> Q2 49.3%, a decline of 2.6 percentage points
1.5K: Q1 31.4% -> Q2 33.2%, a gain of 1.8 percentage points
720P: Q1 7.7% -> Q2 8.6%, a gain of 0.9 percentage point
2K: Q1 5.5% -> Q2 5.5%, flat
Others: Q1 3.6% -> Q2 3.4%, a decline of 0.2 percentage point
1080P remained the largest resolution category at 49.3%, but it lost share quarter-over-quarter. The main beneficiary was 1.5K, which rose to 33.2%.
The ranking did not change, but the gap between 1080P and 1.5K narrowed further in Q2. 2K stayed essentially unchanged, while 720P moved up slightly.
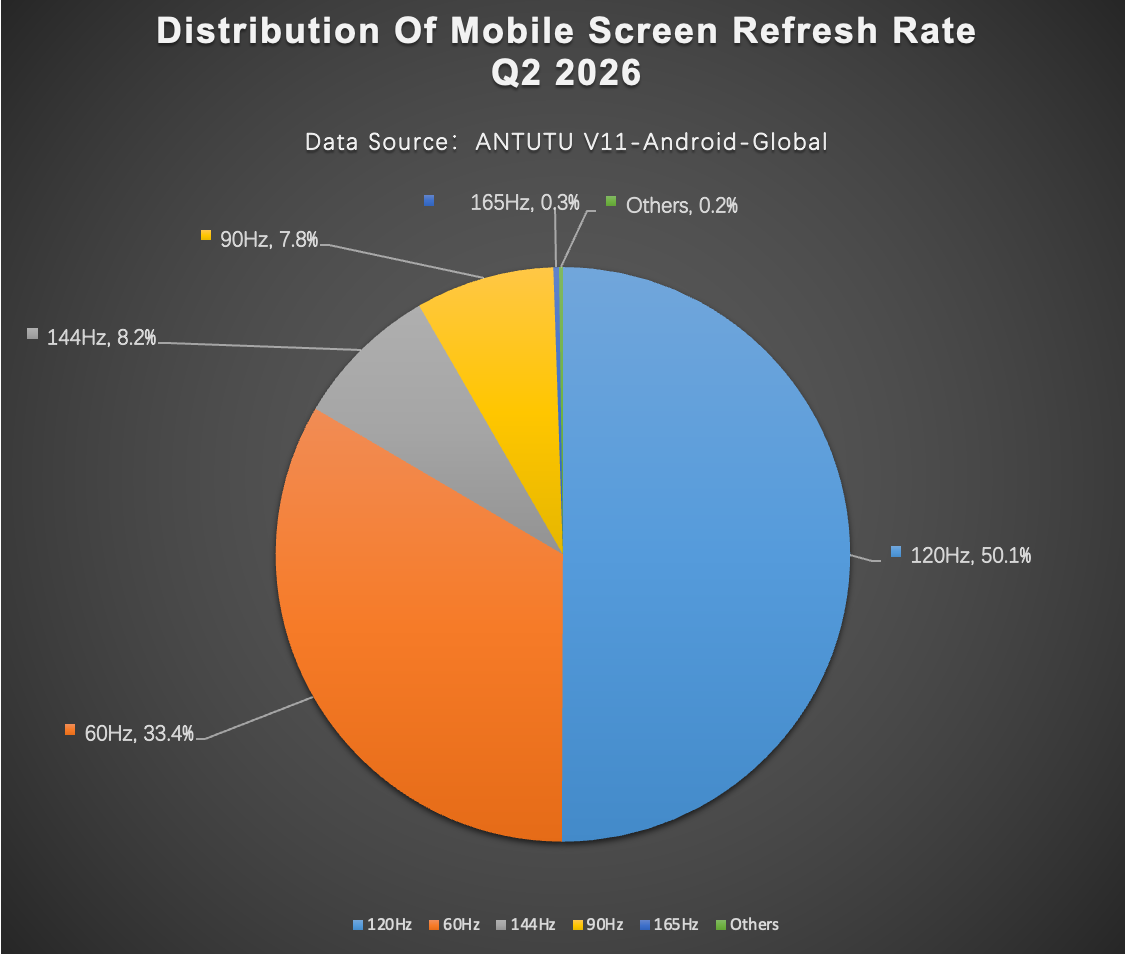
SCREEN REFRESH RATE
120Hz: Q1 50.1% -> Q2 49.1%, a decline of 1.0 percentage point
60Hz: Q1 33.4% -> Q2 32.8%, a decline of 0.6 percentage point
144Hz: Q1 8.2% -> Q2 10.0%, a gain of 1.8 percentage points
90Hz: Q1 7.8% -> Q2 7.9%, a gain of 0.1 percentage point
165Hz: Q1 0.3% -> Q2 0.3%, flat
120Hz remained the leading refresh-rate category in Q2, though its share slipped below the 50% threshold to 49.1%. 60Hz also declined slightly, falling to 32.8%.
The more visible movement came from 144Hz, which rose from 8.2% to 10.0%. That makes it the only refresh-rate tier in the main group to record a meaningful gain this quarter.
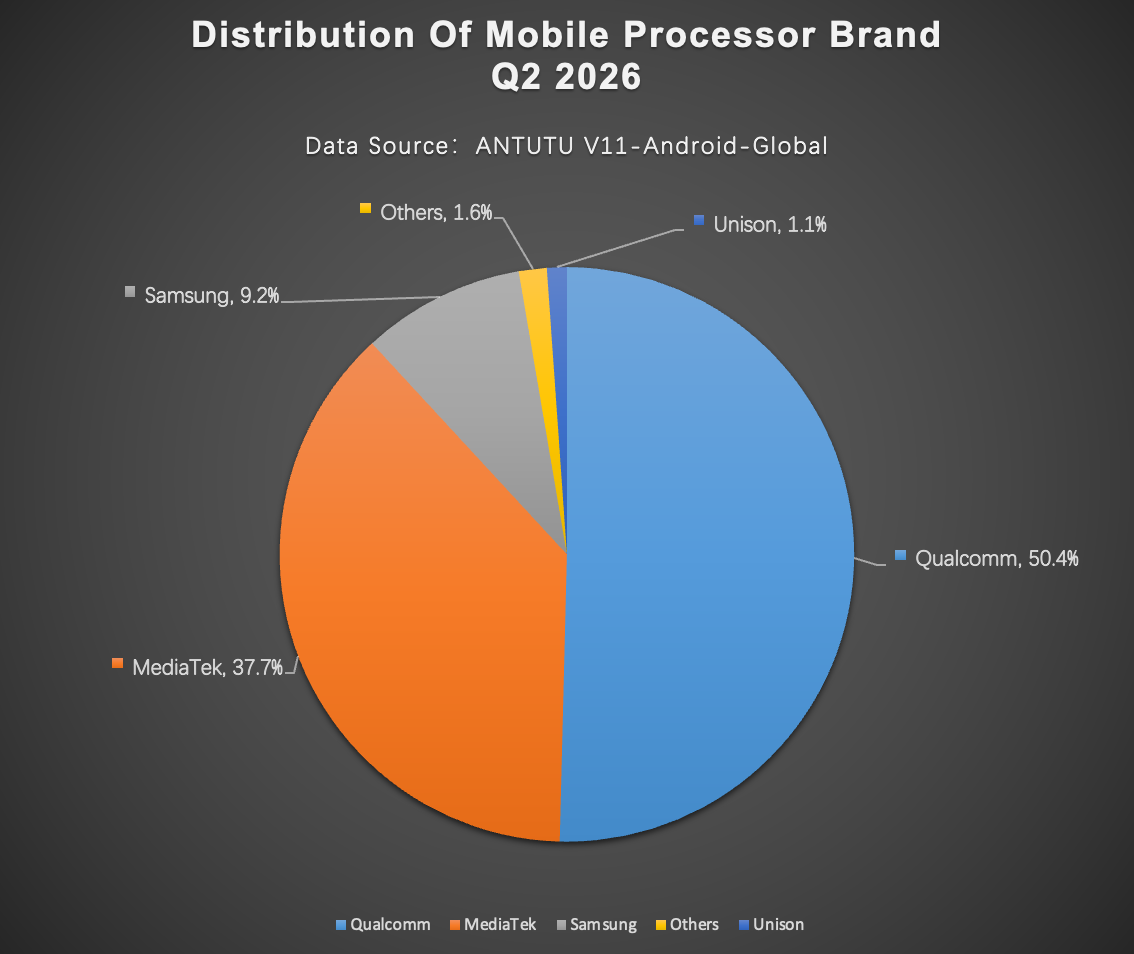
PROCESSOR BRAND
Qualcomm: Q1 53.3% -> Q2 50.4%, a decline of 2.9 percentage points
MediaTek: Q1 35.1% -> Q2 37.7%, a gain of 2.6 percentage points
Samsung: Q1 8.6% -> Q2 9.2%, a gain of 0.6 percentage point
Unisoc: Q1 1.2% -> Q2 1.1%, a decline of 0.1 percentage point
Others: Q1 1.7% -> Q2 1.6%, a decline of 0.1 percentage point
Qualcomm continued to lead the processor-brand distribution at 50.4%, but its share fell by 2.9 percentage points from Q1. MediaTek moved in the opposite direction, rising to 37.7%.
The gap between Qualcomm and MediaTek narrowed from 18.2 percentage points in Q1 to 12.7 points in Q2. Samsung also posted a small gain, while Unisoc and Others remained minor categories.
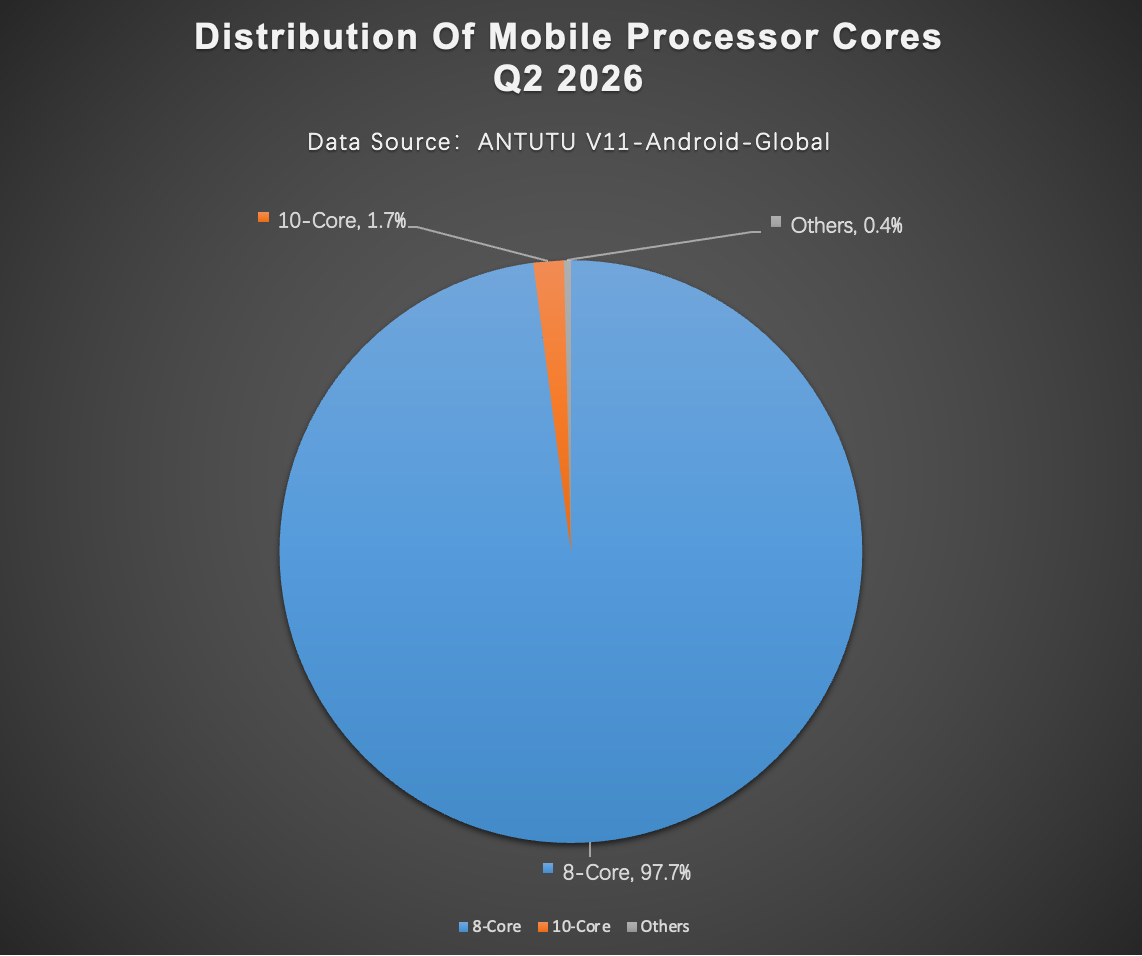
CPU CORE COUNT
8-Core: Q1 97.7% -> Q2 97.7%, flat
10-Core: Q1 1.6% -> Q2 1.7%, a gain of 0.1 percentage point
12-Core: Q1 0.0% -> Q2 0.2%, a gain of 0.2 percentage point
Others: Q1 0.4% -> Q2 0.4%, flat
CPU core count remained the most stable dimension in this report. 8-core processors still accounted for 97.7% of the sample, leaving little room for other configurations.
10-core and 12-core processors were present, but their combined share remained below 2%.
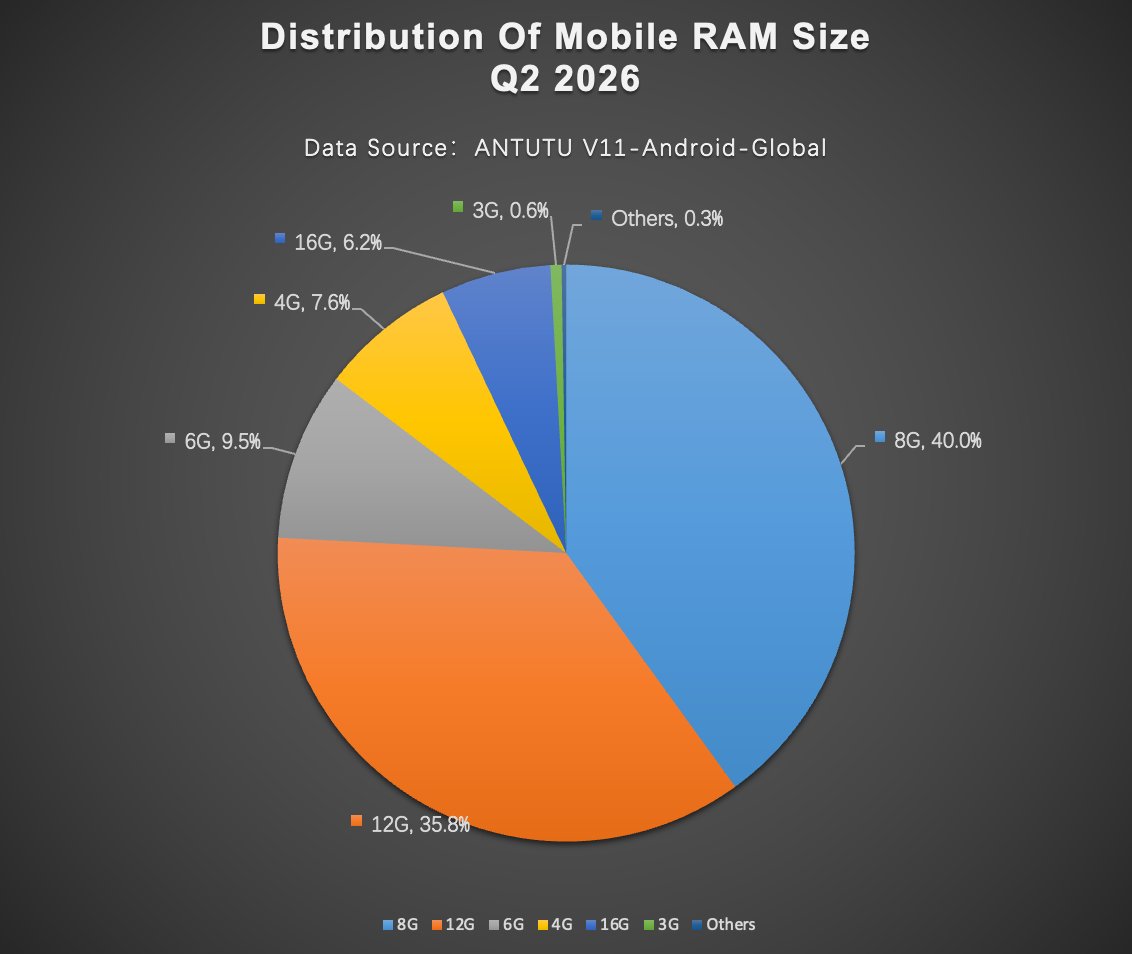
RAM
8GB: Q1 39.3% -> Q2 40.0%, a gain of 0.8 percentage point
12GB: Q1 36.1% -> Q2 35.8%, a decline of 0.3 percentage point
6GB: Q1 9.8% -> Q2 9.5%, a decline of 0.3 percentage point
4GB: Q1 7.0% -> Q2 7.6%, a gain of 0.6 percentage point
16GB: Q1 6.8% -> Q2 6.2%, a decline of 0.7 percentage point
8GB remained the largest RAM category in Q2, reaching 40.0%. 12GB followed closely at 35.8%, keeping the two categories far ahead of the rest of the distribution.
Together, 8GB and 12GB accounted for nearly 76% of the sample. The quarter-over-quarter movement was mixed: 8GB and 4GB gained share, while 6GB, 12GB and 16GB declined.
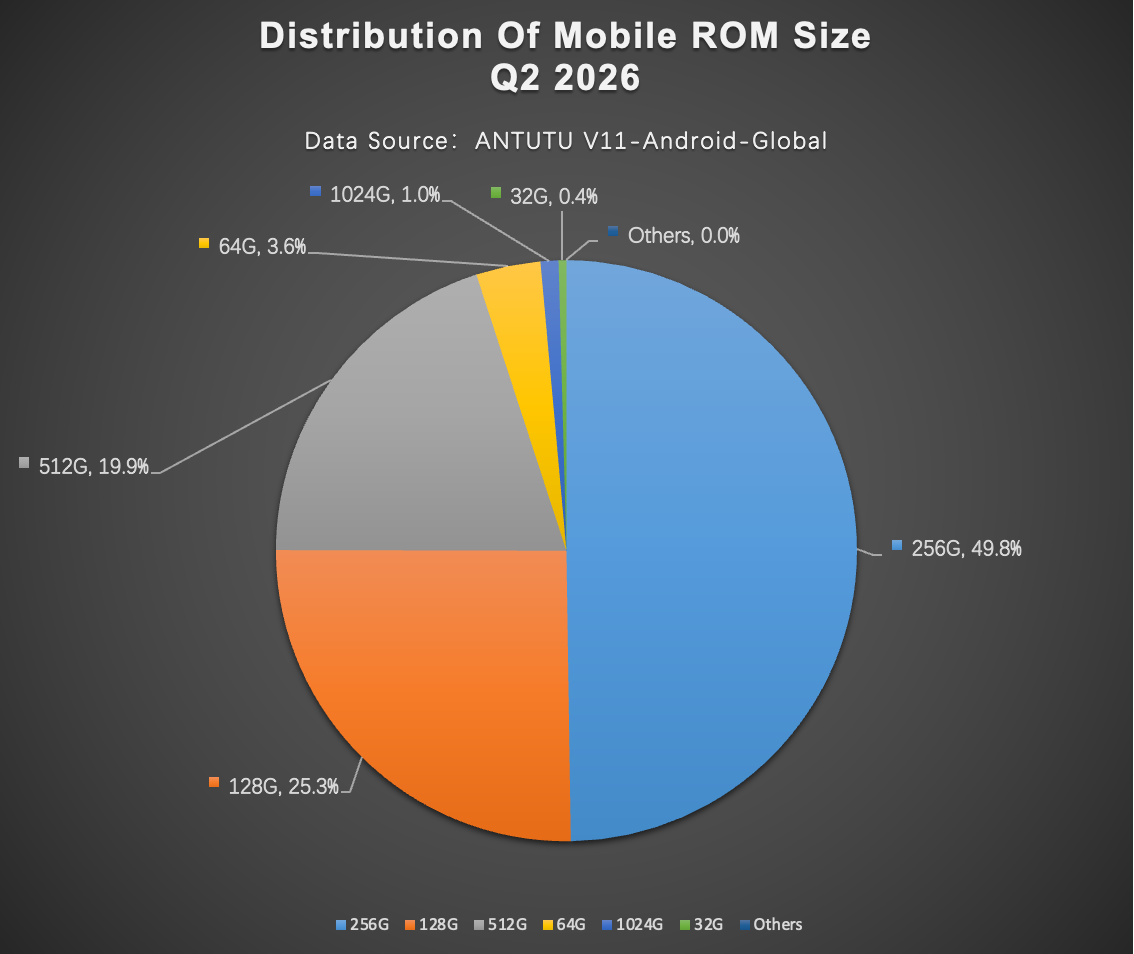
STORAGE
256GB: Q1 49.7% -> Q2 49.8%, flat
128GB: Q1 26.1% -> Q2 25.3%, a decline of 0.8 percentage point
512GB: Q1 18.8% -> Q2 19.9%, a gain of 1.1 percentage points
64GB: Q1 3.7% -> Q2 3.6%, a decline of 0.1 percentage point
1TB: Q1 1.2% -> Q2 1.0%, a decline of 0.2 percentage point
256GB remained the dominant storage tier at 49.8%, almost unchanged from Q1. 128GB continued to rank second, but its share slipped to 25.3%.
512GB recorded the clearest gain in this category, rising from 18.8% to 19.9%. 1TB, however, moved down slightly to 1.0%, so the shift toward larger storage was not uniform across all high-capacity tiers.
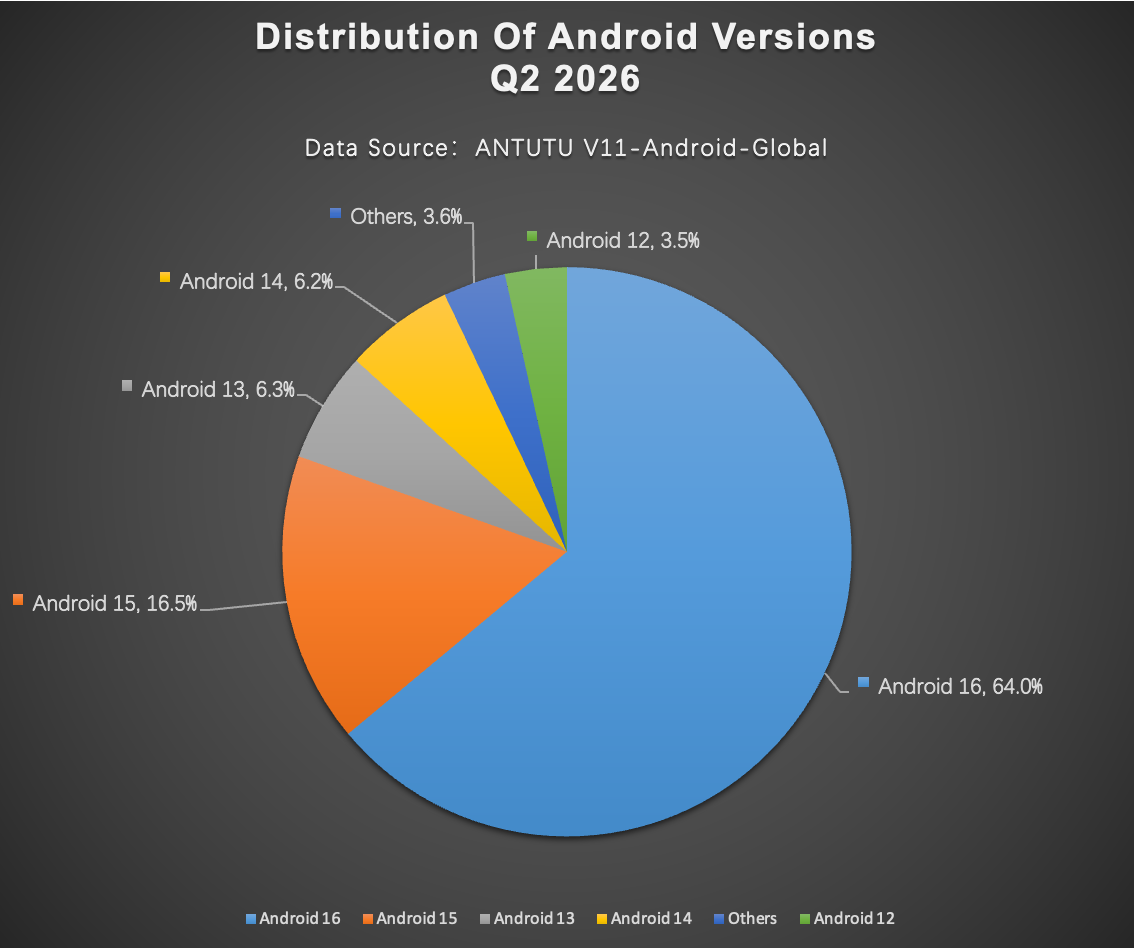
ANDROID VERSION
Android 16: Q1 52.1% -> Q2 64.0%, a gain of 11.9 percentage points
Android 15: Q1 27.0% -> Q2 16.5%, a decline of 10.5 percentage points
Android 14: Q1 6.9% -> Q2 6.2%, a decline of 0.7 percentage point
Android 13: Q1 6.7% -> Q2 6.3%, a decline of 0.4 percentage point
Android 12: Q1 3.8% -> Q2 3.5%, a decline of 0.3 percentage point
Android version distribution saw the sharpest movement of any category in Q2. Android 16 expanded its lead to 64.0%, while Android 15 fell to 16.5%.
Android 12 and Android 13 still accounted for a combined 9.8%, showing that older versions remain present among AnTuTu users in the global market (excluding mainland China).
KEY TAKEAWAYS
Large screens still dominate, but the over-6.7-inch category lost share as the 6.5-6.7-inch tier moved closer.
1.5K resolution continued to gain share, narrowing the gap with 1080P.
120Hz remained the leading refresh-rate category, but 144Hz was the clearest gainer in Q2.
Qualcomm still led processor brands, while MediaTek narrowed the gap significantly.
Android 16 adoption was the strongest single movement in the report, rising by 11.9 percentage points from Q1.
Data Source: AnTuTu Benchmark, Q2 2026 user configuration statistics for the global market (excluding mainland China). Sample base: AnTuTu users in the global market (excluding mainland China) with valid device submissions. Figures may not sum to 100% due to rounding. All quarter-over-quarter changes are expressed in percentage-point terms unless otherwise noted.