Q1 2026 Android User Preference Report — Global Markets
Following the Q4 2025 report, the Q1 2026 edition draws from a broader statistical sample of AnTuTu’s global users, capturing the configuration landscape of the global Android smartphone market at the start of a new year cycle. Compared to monthly benchmarks, quarterly data reflects structural shifts driven by upstream supply chains, manufacturer roadmap decisions, and evolving consumer preferences. This report examines eight key hardware dimensions: screen size, resolution, refresh rate, processor brand, CPU core count, RAM, ROM, and Android version.
SCREEN SIZE
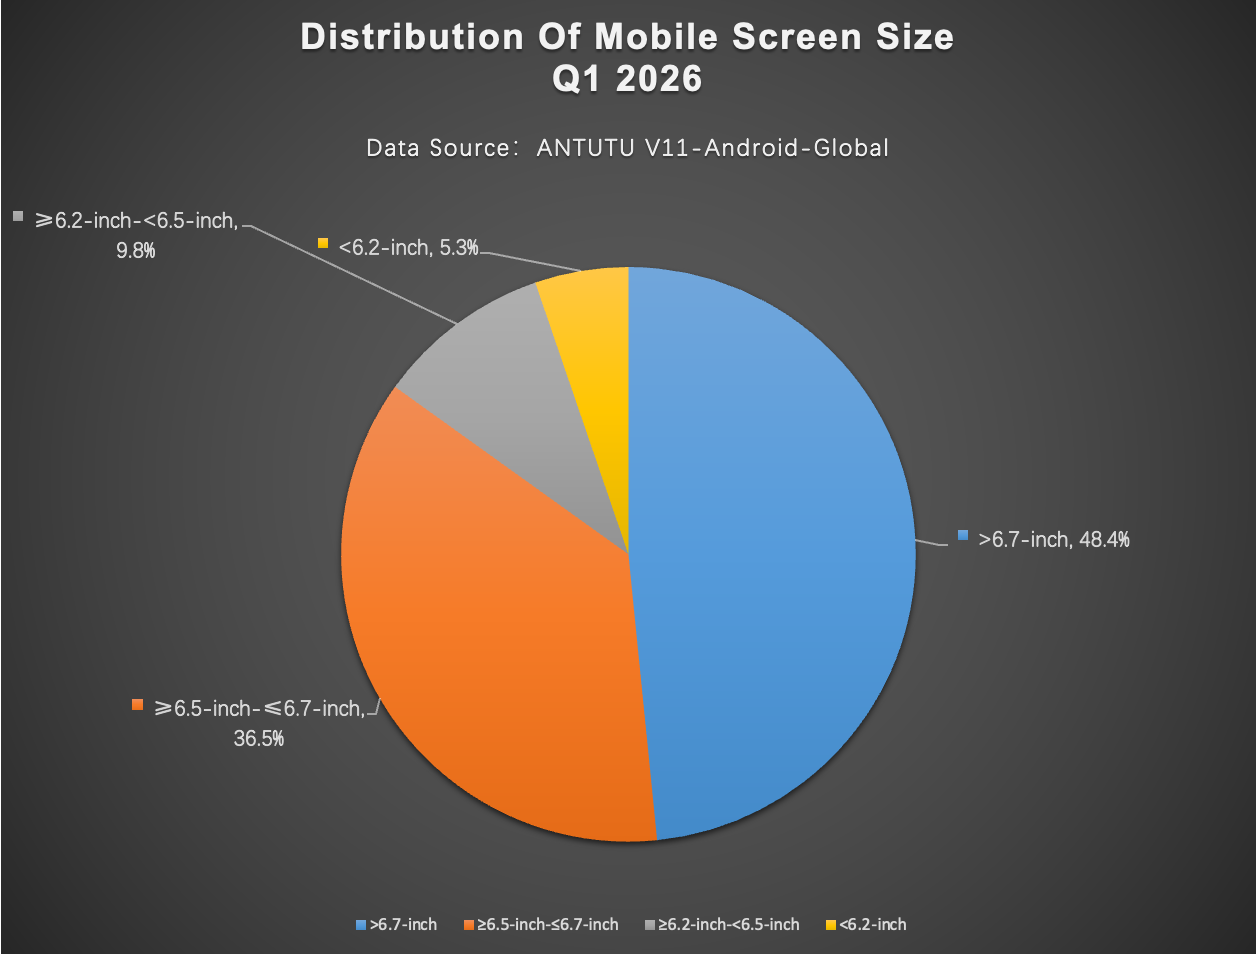
The >6.7-inch category extended its dominance through Q1, gaining 6 percentage points quarter-over-quarter to reach 48.4% — the single largest share among all screen-size brackets. The adjacent >=6.5–6.7-inch tier, historically the second-largest, shed 3.5pp and now sits at 36.5%. Together, these two categories account for 84.9% of the overseas Android user base.
Smaller screen sizes continued their decline. The >=6.2–<6.5-inch band dropped 1.6pp to 9.8%, while the <6.2-inch category fell 1.1pp to 5.3%. This divergence between large-display and compact-device categories mirrors a pattern seen in prior quarters: for the majority of overseas markets, a “small phone” is functionally absent from current product lineups. Premium-tier compact devices remain a niche reserved for a handful of manufacturers.
SCREEN RESOLUTION

1080P: Q4 53.5% -> Q1 51.9%, a decline of 1.6 percentage points1.5K: Q4 29.7% -> Q1 31.4%, a gain of 1.7 percentage points720P: Q4 7.4% -> Q1 7.7%, a gain of 0.3 percentage point2K: Q4 5.8% -> Q1 5.5%, a decline of 0.3 percentage point
1080P remains the plurality resolution at 51.9%, though its share contracted 1.6pp in Q1 as the 1.5K tier — a category that barely existed two years ago — expanded by a near-identical 1.7pp to 31.4%. The 1.5K category (typically 2772x1240 or equivalent) has been rapidly adopted by Chinese OEMs targeting mid-to-premium segments and is gaining traction in overseas markets as device imports reflect this specification shift.
720P held relatively flat at 7.7%, representing entry-level devices that continue to serve price-sensitive markets in Southeast Asia, South Asia, and parts of Latin America. 2K resolution remained essentially unchanged at 5.5%, a tier largely confined to flagship devices where it has become a baseline spec rather than a differentiating selling point.
SCREEN REFRESH RATE
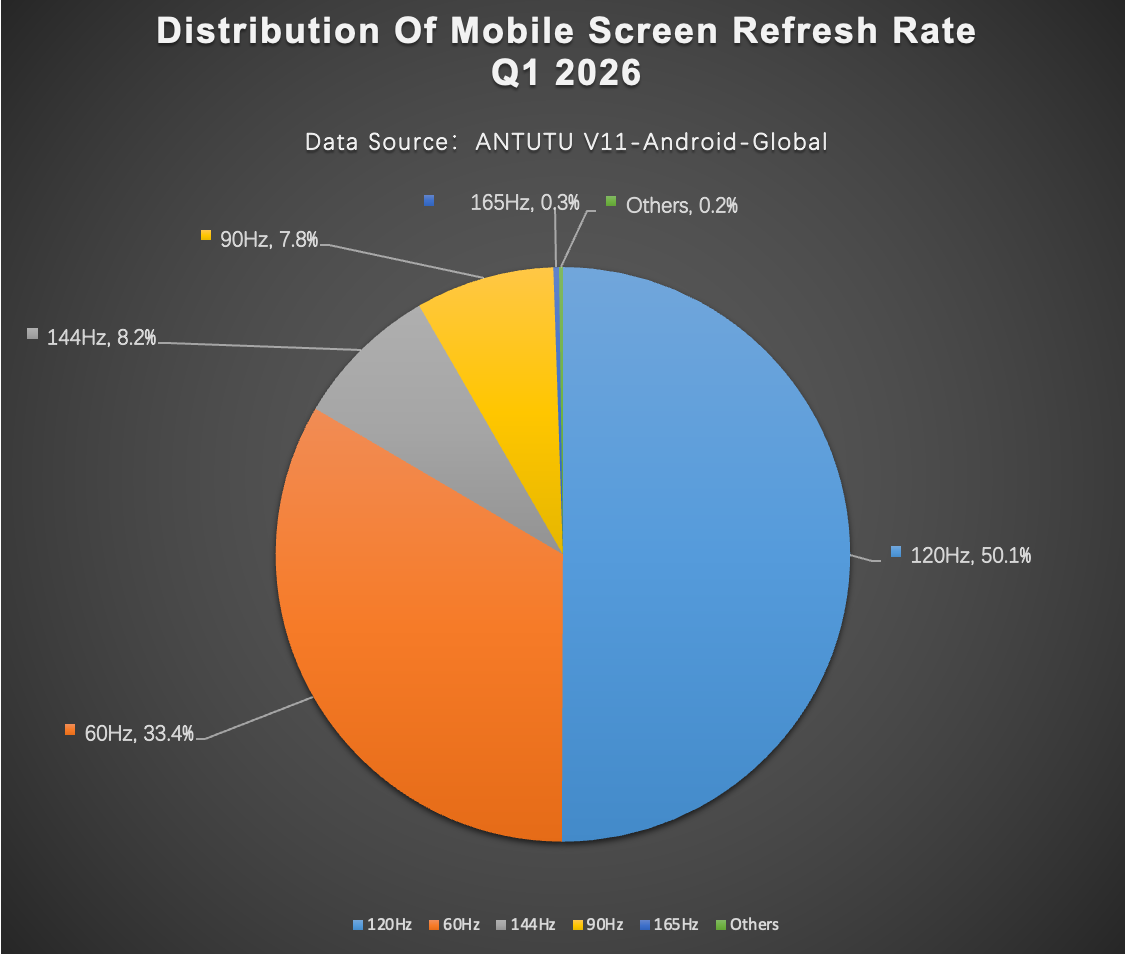
120Hz: Q4 49.1% -> Q1 50.1%, a gain of 1.0 percentage point60Hz: Q4 32.8% -> Q1 33.4%, a gain of 0.6 percentage point144Hz: Q4 10.0% -> Q1 8.2%, a decline of 1.8 percentage points90Hz: Q4 7.9% -> Q1 7.8%, a decline of 0.1 percentage point165Hz: Q4 0.3% -> Q1 0.3%, flat
120Hz extended its lead to cross the 50% threshold, reaching 50.1% in Q1 — a milestone indicating that high refresh rate has become the default expectation for the majority of new Android devices globally. The 60Hz category, rather than declining, edged up 0.6pp to 33.4%, likely reflecting a combination of entry-level new activations and the prevalence of LTPO-based variable refresh implementations that default to lower Hz during static display.
144Hz experienced the most notable pullback among refresh rate tiers, falling 1.8pp to 8.2%. This category is heavily weighted toward gaming-oriented devices; its contraction may reflect a shift in gaming phone product cycles or a broader market preference for balanced 120Hz displays over specialized high-Hz hardware.
PROCESSOR BRAND
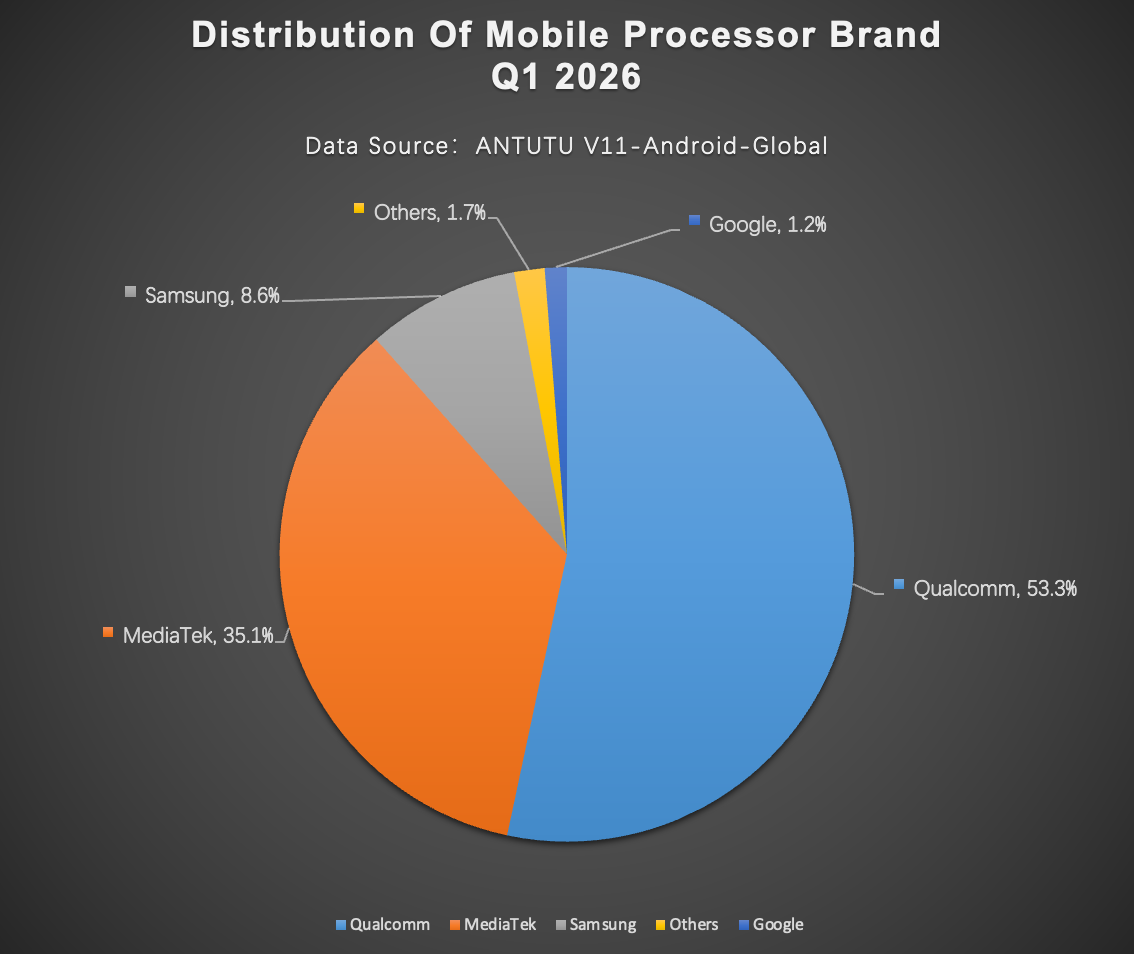
Qualcomm: Q4 53.0% -> Q1 53.3%, a gain of 0.3 percentage pointMediaTek: Q4 35.4% -> Q1 35.1%, a decline of 0.3 percentage pointSamsung: Q4 8.6% -> Q1 8.6%, flatGoogle: Q4 1.3% -> Q1 1.2%, a decline of 0.1 percentage pointOthers: Q4 1.8% -> Q1 1.7%, a decline of 0.1 percentage point
The processor landscape was broadly stable in Q1. Qualcomm maintained a commanding lead at 53.3%, with MediaTek in second place at 35.1% — a gap of 18.2 percentage points. Samsung’s Exynos silicon held steady at 8.6%, a share that reflects the limited geographic distribution of Exynos-powered Galaxy devices relative to Qualcomm-powered variants in overseas markets.
The relative equilibrium between Q4 and Q1 masks underlying competitive dynamics: Qualcomm’s Snapdragon 8 Elite (Gen 4) and Snapdragon 8s Gen 3 have consolidated the premium tier, while MediaTek’s Dimensity 9300 and 8400 series continue to serve the upper-midrange segment. The margin between the two leaders has not meaningfully narrowed in consecutive quarters, suggesting a structural duopoly with no immediate challenger.
CPU CORE COUNT
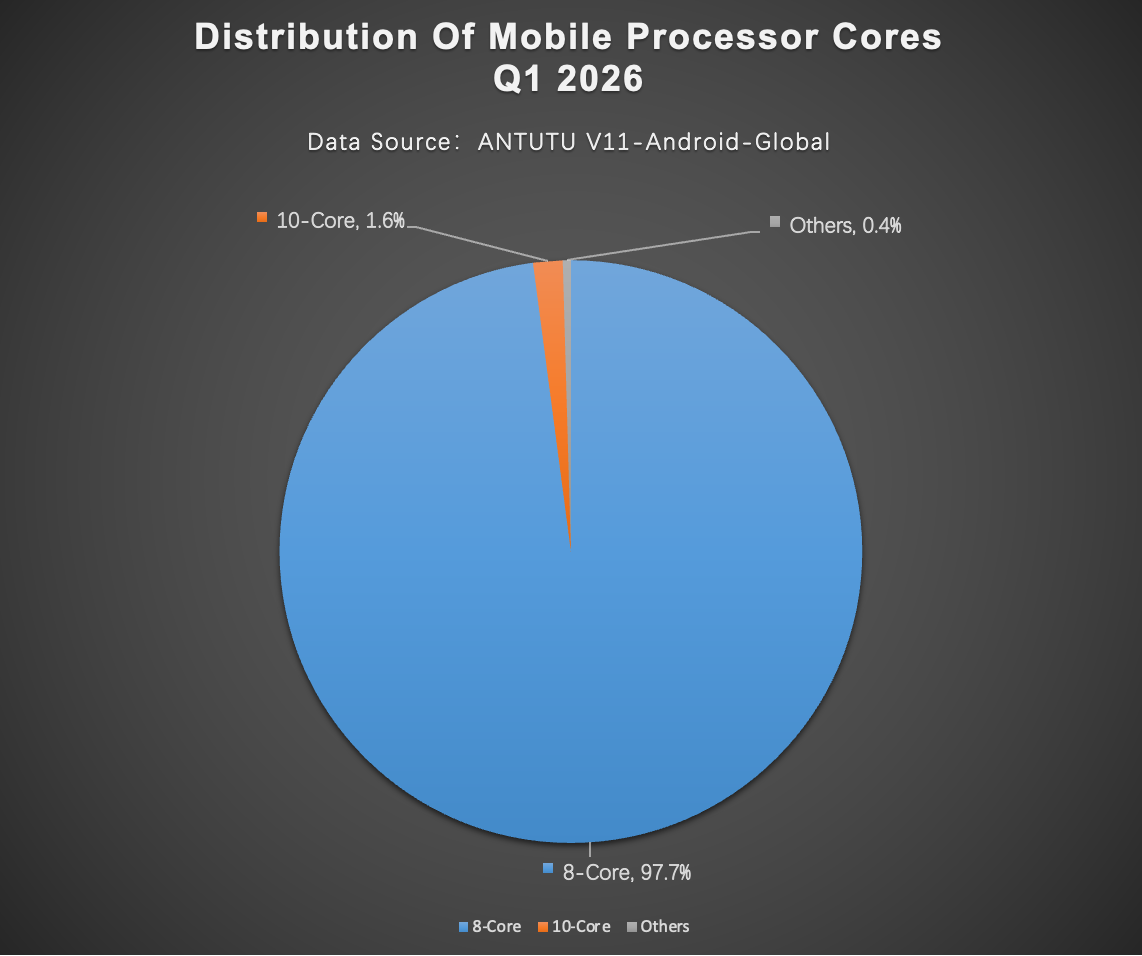
8-Core: Q4 97.7% -> Q1 97.7%, flat10-Core: Q4 1.67% -> Q1 1.63%, a decline of 0.04 percentage point9-Core: Q4 0.21% -> Q1 0.20%, a decline of 0.01 percentage pointOthers: Q4 0.37% -> Q1 0.45%, a gain of 0.08 percentage point
CPU core counts represent the most structurally stable dimension in this report. 8-core designs have held at approximately 97.7% for multiple consecutive quarters, with no meaningful deviation. This near-universal adoption reflects the maturation of the big.LITTLE heterogeneous architecture across all major chipmakers. 10-core and 9-core configurations represent specialized or legacy silicon with negligible market presence in the current device cycle.
RAM
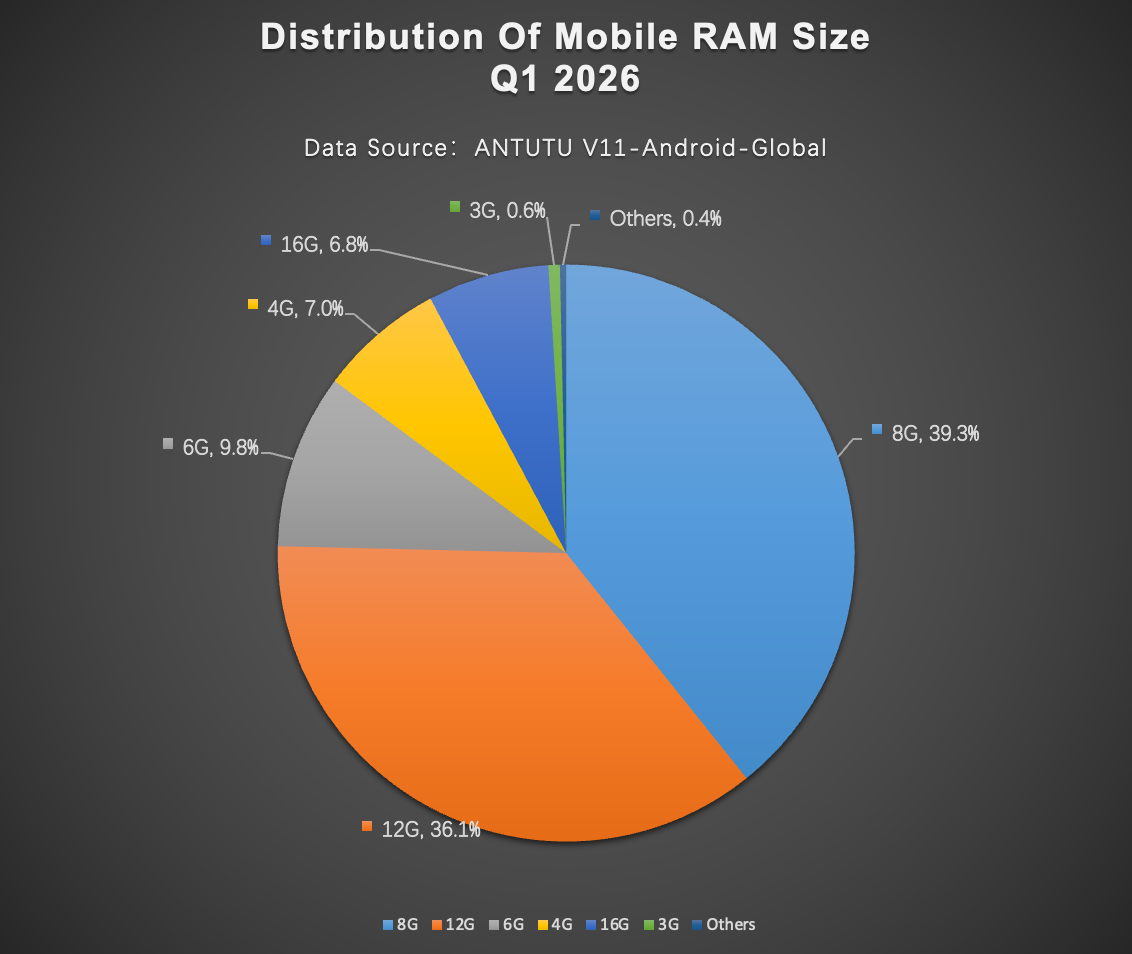
8GB: Q4 40.0% -> Q1 39.3%, a decline of 0.7 percentage point12GB: Q4 35.6% -> Q1 36.1%, a gain of 0.5 percentage point6GB: Q4 10.3% -> Q1 9.8%, a decline of 0.5 percentage point16GB: Q4 6.6% -> Q1 6.8%, a gain of 0.2 percentage point4GB: Q4 6.6% -> Q1 7.0%, a gain of 0.4 percentage point3GB: Q4 0.6% -> Q1 0.6%, flatOthers: Q4 0.3% -> Q1 0.4%, a gain of 0.1 percentage point
RAM distribution in Q1 shows a slow but consistent upward migration in capacity. 12GB is the plurality category (36.1%), while 8GB sits at 39.3% — a narrowing gap that signals an imminent crossover. The overseas market appears to be approximately two to three quarters behind the domestic China cycle in RAM tier progression.
16GB grew modestly by 0.2pp to 6.8%, a figure that will likely accelerate as flagship devices from Chinese OEMs increasingly ship with 16GB as the base configuration in their overseas SKUs. The 6GB category, representing the entry-level midrange tier, contracted 0.5pp to 9.8%, continuing a gradual phase-out.
ROM
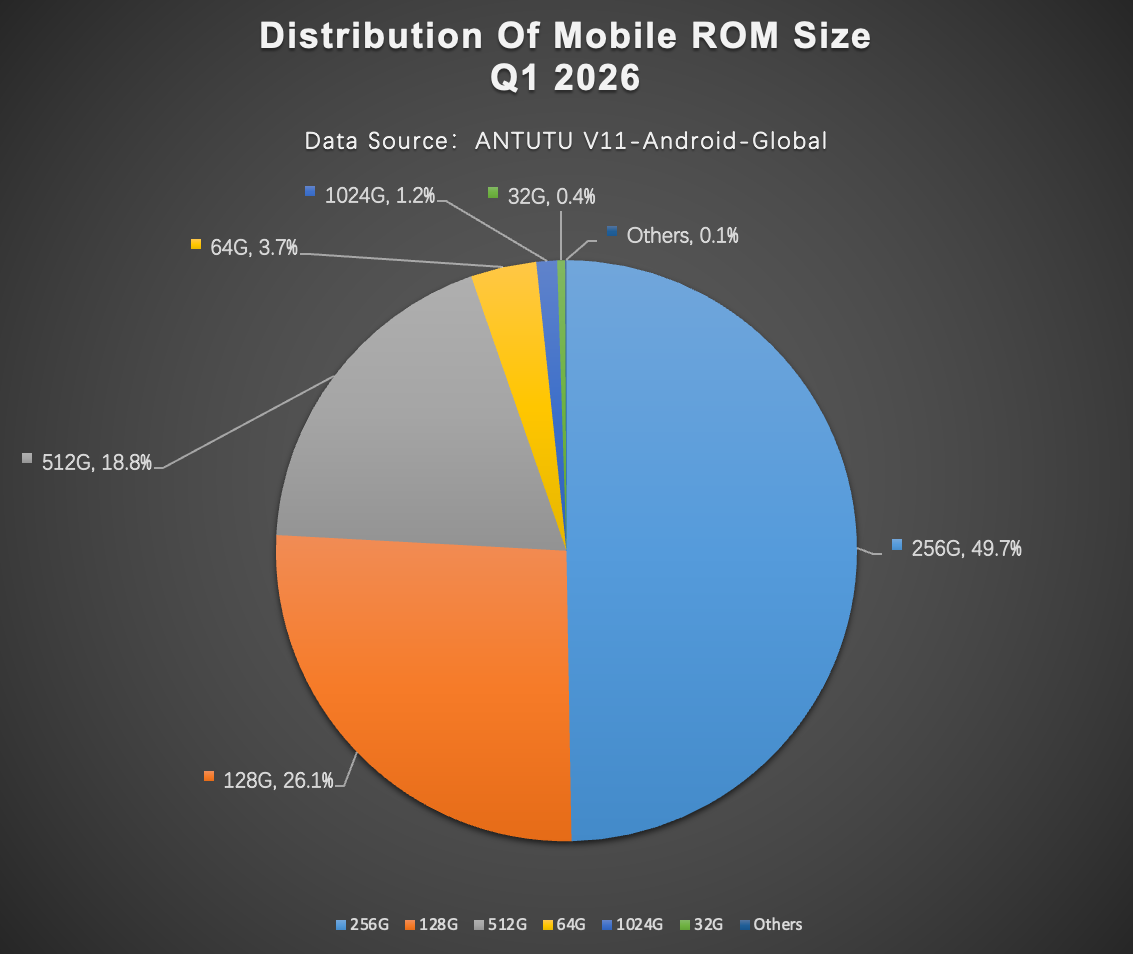
256GB: Q4 49.8% -> Q1 49.7%, a decline of 0.1 percentage point128GB: Q4 27.1% -> Q1 26.1%, a decline of 1.0 percentage point512GB: Q4 18.0% -> Q1 18.8%, a gain of 0.8 percentage point64GB: Q4 3.6% -> Q1 3.7%, a gain of 0.1 percentage point1TB: Q4 1.0% -> Q1 1.2%, a gain of 0.2 percentage point32GB: Q4 0.4% -> Q1 0.4%, flatOthers: Q4 <0.1% -> Q1 0.1%, flat
256GB solidified its position as the dominant storage tier at 49.7%, essentially flat quarter-over-quarter. The most notable movement was the 1.0pp decline of 128GB to 26.1%, as consumers continued to migrate toward higher capacity tiers. 512GB gained 0.8pp to 18.8%, the second-largest absolute gain in ROM categories. 1TB expanded modestly by 0.2pp to 1.2%, reflecting the early stages of ultra-high-capacity adoption in overseas markets — lagging well behind the domestic market where 1TB penetration is significantly higher.
ANDROID VERSION
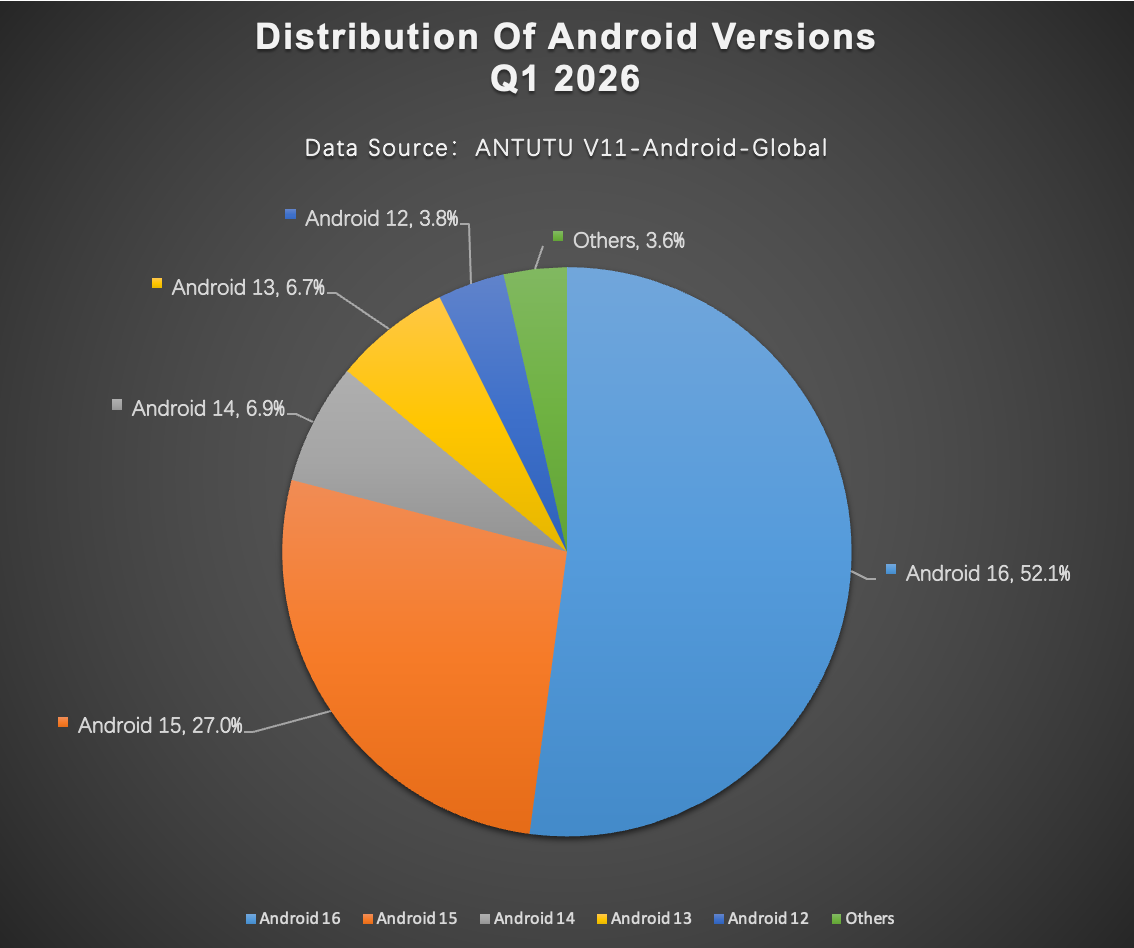
Android 16: Q4 25.7% -> Q1 52.1%, a gain of 26.4 percentage pointsAndroid 15: Q4 51.7% -> Q1 27.0%, a decline of 24.7 percentage pointsAndroid 14: Q4 8.3% -> Q1 6.9%, a decline of 1.4 percentage pointsAndroid 13: Q4 7.1% -> Q1 6.7%, a decline of 0.4 percentage pointAndroid 12: Q4 3.9% -> Q1 3.8%, a decline of 0.1 percentage pointOthers: Q4 3.4% -> Q1 3.6%, a gain of 0.2 percentage point
Android version distribution underwent the most dramatic shift of any category in this report. Android 16 surged 26.4pp to claim 52.1% — crossing the majority threshold in a single quarter. Correspondingly, Android 15, which led Q4 at 51.7%, collapsed by 24.7pp to 27.0%. This pattern reflects a familiar cycle: Google releases a new Android major version, and OEM deployment pipelines activate rapidly across flagship and upper-midrange SKUs, causing a near-complete generational handoff within a single quarter.
Android 14 and 13 continued their gradual erosion, while Android 12 and earlier versions collectively represent approximately 7.4% of the active base — devices that have either exhausted or are outside their official update windows. The rapid adoption rate of Android 16 demonstrates that for the overseas Android ecosystem, software currency remains a meaningful differentiator and a priority for both manufacturers and end users.
KEY TAKEAWAYS
Large-screen consolidation is nearly complete. Devices over 6.7 inches now account for nearly half of all overseas Android users. The <=6.2-inch compact segment, at 5.3%, is functionally a relic category.
1.5K resolution is the fastest-growing display spec. Having emerged only in recent product cycles, it now commands nearly one-third of the market — ahead of 720P and closing in on 1080P.
120Hz is the new 60Hz. With 120Hz crossing the 50% threshold, high refresh rate is no longer a differentiator; it is the baseline expectation for any device launched in the midrange or above.
12GB RAM is on the verge of becoming the plurality tier. The overseas market is approximately two to three quarters behind the domestic China cycle in RAM capacity migration, but the trajectory is unmistakable.
Android 16 adoption is the most dramatic single-quarter OS transition observed in recent years. The 26.4pp surge from Android 15 to Android 16 within a single quarter reflects aggressive OEM deployment and a maturing update infrastructure.
Data Source: AnTuTu Benchmark, Q1 2026 overseas user configuration statistics. Sample base: AnTuTu overseas users with qualifying device submissions. Figures may not sum to 100% due to rounding. All quarter-over-quarter changes are expressed in percentage-point terms unless otherwise noted.