Global Top10 Best Performing Android Phones, February 2024

* 1 AnTuTu was developed based on the unique technologies of different platforms, cross-platform products may not be directly comparable.
* 2 The above list, only the popular models will be displayed, monthly update.
* 3 The score displayed is the average of all data for that device, not the highest score for that device.
* 4 The list is global data but does not include the Chinese market, for more information about Chinese market, please visit our Chinese website.
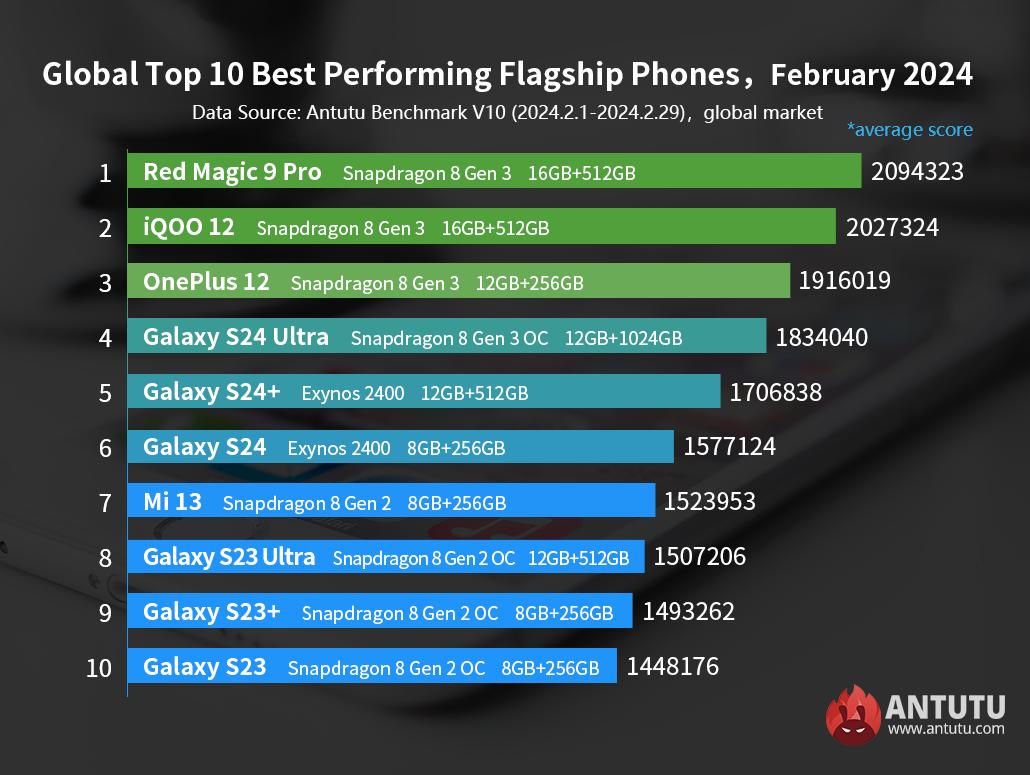
No.1:Red Magic 9 Pro
Average score: 2,094,323
The Red Magic 9 Pro boasts an astonishing full-screen design, with the front camera cleverly concealed beneath the display. Additionally, its screen corners are as square as those of Samsung devices. The phone features an integrated Qualcomm Snapdragon 8 Gen3 processor actively cooled by a built-in turbo fan, resulting in an exceptionally exaggerated gaming performance. Furthermore, it packs a massive 6500mAh battery. However, it does have some disadvantages in terms of screen resolution, camera capabilities, and weight.
No.2: iQOO 12
Average score: 2,027,324
The iQOO 12 boasts a well-balanced configuration that not only meets the requirements for almost all Android games but also excels in photography. Its primary camera and periscope telephoto lens deliver fantastic photo capabilities, benefiting from Vivo’s advanced imaging algorithms. The resulting photos are clean and bright. However, compared to top-tier flagship products, the screen resolution and color representation are slightly inferior.
No.3: OnePlus 12
Average score:1,914,019
The OnePlus 12 boasts a dreamlike configuration, with top-tier or excellent components in terms of screen, camera, battery, and processor. However, its design closely resembles that of the OnePlus 11, which might disappoint some OnePlus fans.
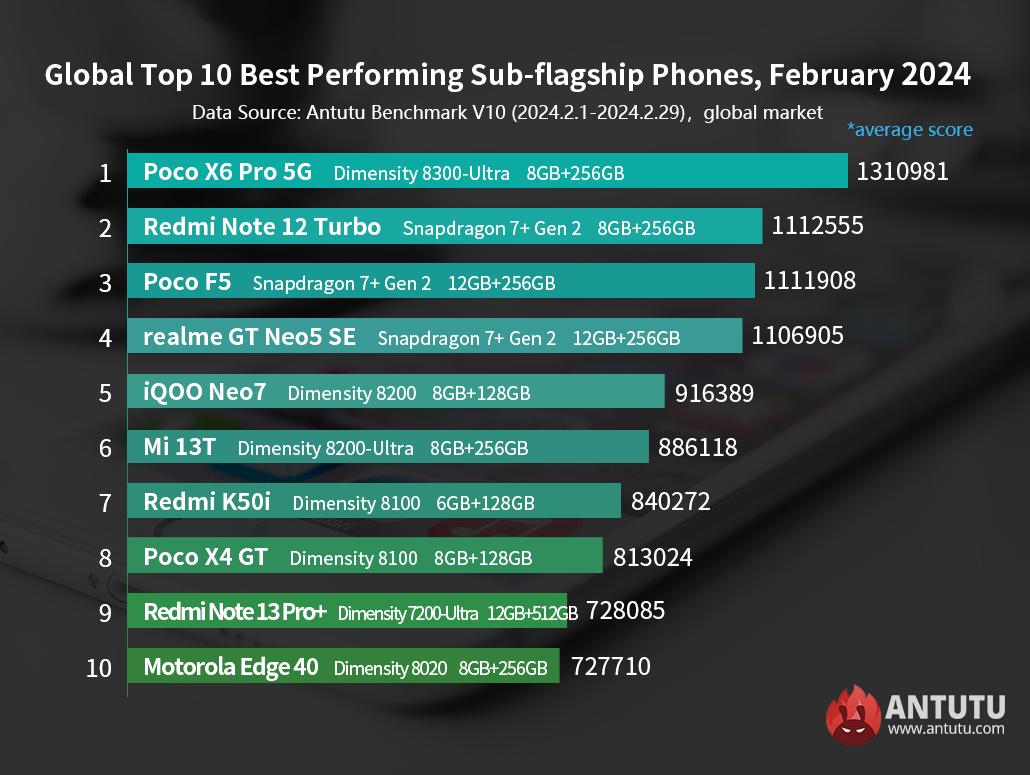
No.1:Poco X6 Pro 5G
Average score: 1,310,981
No.2: Redmi Note 12 Turbo
Average score: 1,112,555
No.3: Poco F5
Average score:1,111,908
According to the positioning by SoC manufacturers, we classify certain models here. Relatively speaking, these devices are more affordable and still offer a very decent user experience.
Only the top 10 models with AnTuTu scores are listed here, and more models' Ranking info can be found on the "Ranking" page.
The same device in the Antutu V10 will generally score higher than the V9. One reason is that the new 3D test scene is more stressful, corresponding to higher scores. Another reason is that there are more video compatibility and codec test items in the UX test, which will also make the score higher.
Here is just to explain the reason why the score is generally higher. Please note that AnTuTu V10 scores cannot be compared to V9, and the device scores can only be compared between the same version of AnTuTu Benchmark.
In addition, in order to deliver stunning image quality and precision comparable to that of the PC, AnTuTu has created two new 3D test scenes based on Unreal Engine 4. To make the output colors more realistic and detailed, we uniformly use FP32 precision in the new scenes. However, due to the higher number of FP16 units in GPU chips released in earlier years, and limited by earlier chip manufacturing processes and technologies, GPUs will combine two FP16 units to be used as an FP32 unit when performing FP32-precision calculations, and such calculations need to consume more additional computational resources, which results in poor performance on new test scenes with these GPUs, and this is more obvious on GPU chips before Mali-G710 (not included).


